The Project Proposal
Publications (pdf)
CARTOGRAPHIC VISUALIZATION OF AGRICULTURAL SENSOR BASED INFORMATION
Running project - LGC (MU, Brno), grant no. 205/09/1437 of the Czech Science Foundation
1. Current state of the art
1.1. Introduction
The relationships between human society and the land have been progressively transformed as a result of dramatic changes in the course of the 20th century, particularly by increasing industrialization, the mechanization of agriculture, immediacy in global trade and communication. National, regional and international perspectives on agriculture must examine these and other factors in order to provide the best possible basis for allocating resources, establishing rules, formulating policy, making decisions and finally work with useful control system. More people are becoming aware of the effects to the soil that years of farming and using chemical fertilizers and other chemicals have caused. In that case it’s necessary to build up a clear control system for fertilizer chemicals in crop production, crop process in food production and food market. Today there exist many laws, public notices, state standards in crop production and post processing and in many times it is not possible to get all important information about specific crop on one paper. To place this information on web pages make things easier, but crop production is less unite with country side and rural areas and people living in this part mainly have less experience with Information technologies than people in the cities.
Fifth Framework Program start up a research activities and build up a models to spread out systems of progressive farm management (System of Precision farming) by using an information technologies in crop production and food market. This group of farmers and people working in service and grain purchase companies has got a yearly experience how to start with information technologies and use IT in their work. These experiences are mainly from data collecting, data processing, data application and data controlling in crop fertilizing and crop protection. With advent of wireless communication technology and sensors there is a new possibility for a true integration of agricultural data and interoperable geospatial infrastructure.
1.2. Cartographic visualization
The effectiveness of decision-making in agriculture domain can be improved by integrating current local environmental and agromonitoring with Geographic Information System (GIS) and sensor web applications. Effectiveness of any information system can be evaluated on the basis of its ability to deliver relevant, accurate, and timely information. Every sensor used for agricultural applications has a location, and a sensor location is almost always important. The spatial extension and near real time availability of sensor information layers in geospatial applications create a great potential. Soil quality, air pressure and crop sensor characteristics in a specific region can be automatically read at frequent intervals and those readings can be aggregated with map layers from diverse sources into spatial data representation/visualization for diverse purposes. Interoperable web services and data encoding models for Spatial Data Infrastructures (SDI) further foster the integration of geo-sensors data with spatio-temporal models. Currently - with the use of intelligent approach to databases and interactive user support - it is possible to find applicable maps on the Internet, but also to create and modify these maps according to specific and individual requirements. Instead of mere utilization of maps created by someone else beforehand, these new geoinformation technologies allow individuals to use cartography interactively, examine and represent spatial information according to specific needs of the particular user. The goal is not only to offer more information to farmers, but offer it in a way which would not task one’s mind.
New technologies allow „live connection“ to the instinctive inner sphere of our spatial cognition via direct interaction with a new generation of cartographic visualization and thus with potentially infinite resources of the Internet.
Map is a representation of geographic reality with the use of symbols representing selected qualities and characteristics resulting from creative efforts and selection performed by its authors. It is created for further use; spatial relations are of primary importance. Together with new cartographic tools (GIS) based on interactive web maps, it is possible to provide mutual interaction map-user (including map data sources).
Cartography in its new form is a unique instinctive multi-dimensional tool, which can be used in research, analyses, and communication of geospatial data. It can utilize available resources on the WWW. Therefore, a map is more than just space for manipulating and creating images; it can be a graphic window with unlimited possibilities. There is necessary to stress, that in this meaning “cartography” is not working and influencing just the “map window”, but its part is also the structure of information and interface – together they make formidable tool of wide usability.
This new visual-mental environment uses advantages of our cognitive, instinctive mapping, which can be even more effective if it is performed with the use of geovisual dialogue with cartographic visualization systems.
1.3. Sensor networks and SWE
A sensor network is a computer accessible network of many, spatially distributed devices using sensors to monitor conditions at different locations, such as temperature, sound, vibration, pressure, motion or pollutants. A Sensor Web refers to web accessible sensor networks and archived sensor data that can be discovered and accessed using standard protocols and application program interfaces (APIs).
Fig. 1 Sensor Web concept (OGC 2006)
In an Open Geospatial Consortium, Inc. (OGC) initiative called Sensor Web Enablement (SWE), members of the OGC are building a framework of open standards for exploiting Web-connected sensors and sensor systems of all types. SWE presents many opportunities for adding a real-time sensor dimension to the Internet and the Web.
The initial focus of OGC’s SWE has been to investigate standardized interfaces for live sensors operating in near-real-time, rather than the conventional static data stores. It addresses information gathering from distributed, heterogeneous, dynamic information sensors and sources of different structure, based on web services. It is the goal to develop common access, planning, and management interfaces and a descriptive markup language (SensorML) for managing sensor information and metadata in common consistent manners, independent of any application. The individual parts were initially designed to fulfil the following needs (Simonis et al., 2003):
- Describe sensors in a standardized way
- Standardize the access to observed data
- Standardize the process of what is commonly known as sensor planning, but in fact is consisting of the different stages planning, scheduling, tasking, collection, and processing
-
Building a framework and encoding for measurements and observations
Some sensors are already on the Web and able to return their location information as well as observations and measurements. The final missing element - a universal standard framework for describing and tasking sensors in XML - has already been built and prototyped by OGC members. The specifications include:
Sensor Model Language (SensorML) – The general models and XML encoding language for sensors.
Observations & Measurements (O&M) – The general models and an XML encoding for what a sensor observes or measures.
Sensor Collection Service (SCS) – A service by which a client can obtain observations from one or more sensors/platforms (can be mixed types). Clients can also obtain information that describes the associated sensors and platforms.
Sensor Planning Service (SPS) – A service by which a client can determine collection feasibility for a desired set of collection requests for one or more mobile sensors/platforms, or the client may submit collection requests directly to these sensors/platforms.
Web Notification Service (WNS) – A service by which a client may conduct a dialog with one or more other services. This service is useful when many collaborating services are required to satisfy a client request, and/or when significant delays are involved is satisfying the request.
The aforementioned specifications are necessary but not sufficient condition for a fully operable SWE environment. The step further is the development of a real framework of sensors fully compliant with these specifications. SensorNet is a vendor neutral interoperability framework for Web-based discovery, access, control, integration, analysis, and visualization of online sensors, sensor derived data repositories, and sensor related processing capabilities. In other words, SensorNet attempts to create a wide-area system to collect and analyze data from sensors all over the country to monitor and detect threats, and then alert agencies, emergency responders, and others as necessary.
Developing an open standards framework for interoperable sensor networks requires also finding a universal way of connecting two basic interface types – transducer interfaces and application interfaces. This problem is solved by IEEE 1451 standard for transducers interfaces.
1.4. Agricultural applications of sensor networks
Falling producer prices and rising costs of production are increasingly forcing agricultural businesses to optimize production costs. Therefore, the request for the selective use of inputs such as water, fertilizers or chemicals, is now indispensable in modern agriculture. The growing environmental awareness of consumers further accelerates this process. Improved agricultural risk management using the actual knowledge of agricultural indicators becomes more and more important. Every day or hour information made decision more exactly. Plant disease initiation and development is a function of the interaction of several observable factors like soil temperature, air temperature, relative humidity, and other soil and atmospheric variables.
The farmer can for instance define wet temperature low limits (calculated as a function of temperature and relative humidity). Then, when the temperature drops below the predefined thresholds, the software sends an alarm via email or SMS. The farmer can activate frost protection equipment and reduce crop loss to a minimum. The same attitude is applicable in monitoring of growth and development of plants, insects, and many other invertebrate organisms’ endangerment.
New methods of monitoring for agriculture are introduced with new generation of sensors. New generation of so called ”Smart Dust”, which is an emerging sensor technology made up from tiny, wireless sensors or “motes.” These devices are smart enough to talk with other sensors yet small enough to fit on the head of a pin. Each mote is a tiny computer with a power supply, one or more sensors, and a communication system.
An agriculture monitoring could use smart dust to monitor weather data, water balance and provide phonological observation of crops, etc.
2. The aims of the project and proposed schedule
The main aim of project is to design and develop an integrated framework of dynamic cartographic visualisation and modelling tools for agricultural applications based on wireless sensor networks information. The terms “dynamic visualization” describes mainly the possibility to select required scale, interactive creative communication of users and map authors over the Internet, and also presence of simple modelling tools for spatial as well as temporal analysis. Usability of the proposed solution will be evaluated in a scope of information systems acting in the agricultural domain. The pilot area has been selected as a possible extension of the environmental European INSPIRE initiative.
The target of the project is a framework developed for agile accessing heterogeneous sensor data and services, which are necessary for effective decision making in the area of agricultural management. The suggested framework is based on following components:
(1) Heterogeneous distributed network of hierarchical agricultural sensors
(2) Communication infrastructure and standardised interfaces between sensors and the Internet
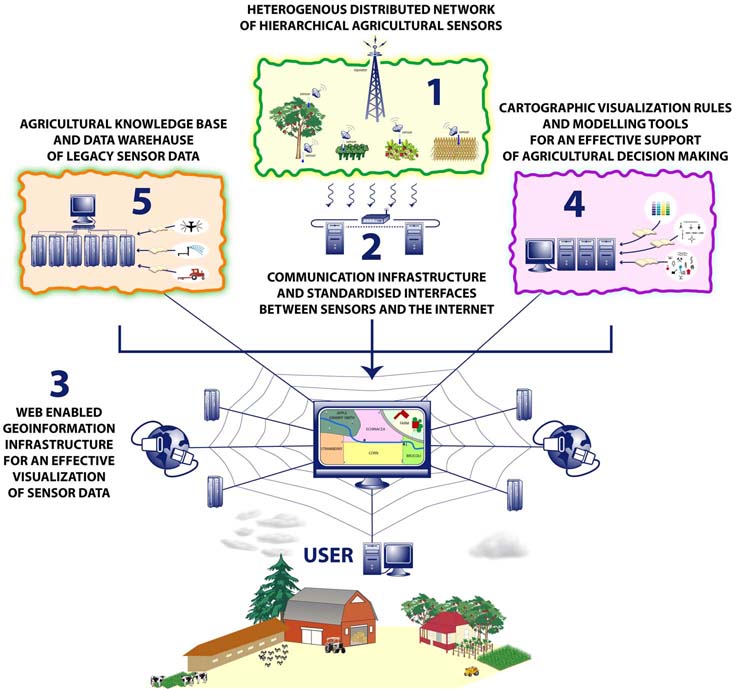
Fig.2 Basic components of the suggested framework
The whole project is divided into 4 workpackages (WPs):
- WP1 – Cartographic visualisation and modelling tools for agriculture
- WP2 – Sensor network development
- WP3 – Agricultural monitoring and knowledge base
- WP4 - Infrastructure integration and proof of concept
Specfic objectives have been establised and mutually interconnected work plan proposed for each WP and underlaying tasks. Each task is described together with expected time schedule and responsible work package leader. Project partner abbreviations are as follows – Masaryk University (MU), Wirelessinfo (WLI), and Mendel University of Agriculture and Forestry in Brno (MUAF).
WP1 Cartographic visualisation and modelling tools for agriculture (WP leader MU)
Cartographic visualisation will be focused primarily on three areas - cartodiagrams, continuous coverage, and change detection. Cartodiagrams (or diagram maps) are specifically aimed on representation of factual values of monitored phenomena via sensors and their evolution in time. The visualization should carry on top of layers of land use (in the sense of crop production) in case there is a need of visual confirmation for taking an action. Cartodiagrams also allows to spot unusual values in data collection. The goal is to use simple, easily readable types of diagrams localized inside the map field and minimize the necessity of study the visual system. For this purpose several types of visualization should be prepared modelled by farmer’s demands and habits. Real-time displayed variable factors of attached sensors with alert capability will be visualised as symbol maps.
From sensor data it is supposed to cartographically model continuous (or pseudo continuous) coverages of selected phenomena. Models will be capable to react in a near real time regime and visualisation of uncertainty will be considered. Continuous coverage of phenomena generated from sensor field, in combination with thematic data, is useful especially for delimitation of areas in need of action (as for example irrigation or crop-spraying). Several types of visual solution will be provided. The last of visual tasks – change detection - is in a way combination of point and area form of visualization. The main goal of this type of sign is to alert the farmer about out of range changes in monitored phenomena and, if possible, to estimate spatial range of the change (hence the combination of point and areal form). Type of alert sign
should be tied to phenomena representation to easy recognition of affiliation.
Interoperability with other topographic and thematic geodata sources will be sought as well. Important part of visualization techniques will support change tracking with amplification of positive or negative trends or possible dangers. WP1 consist of following tasks:
WP1.1 Analysis of cartographic tools and methods in agricultural applications (1/09 – 10/09)
WP1 will start with a comprehensive analysis of exiting methods used for agricultural cartographic techniques both on desktop and the Internet environment. Specific methods will be evaluated against the field gathered data from WP3.1. Important part of this task is to analyse preferred types of visual communication among farmers, to find out what sort of associations they use, and their visual preferences.
WP1.2 Cartographic interface and visualization rules design and evaluation (11/09 – 8/10)
Basic cartographic Internet portal for sensor data and geodata integration and visualisation will be designed and prototyped based on open source interoperable platform. This task will concentrate of the first phase of SWE integration and basic cartographic outputs like simple sensor data and alert visualisation. There have to be careful equalization between base maps (information about the crops etc.), thematic maps (soils etc.) and sensor maps. It is possible to use well known layer based system or there could be also used alternate type of combined visualization. It depends on potential user demands and their ability to adapt.
Cartographic “correctness” of given visualization will be based on a simple perception study with selected end-users. Alternative symbol sets and libraries will be developed and critically evaluated in close cooperation with WP3. Internet portal will, besides the above mentioned cartographic functionality, also comply with basic interoperability rules for a seamless integration of available geospatial resources in the form of OGC web map services.
WP1.3 Modelling tools development and integration (9/10 – 6/11)
Besides the simple visualisation of sensor data and alerts, there will be created a system for cartographic modelling of coverages (surfaces) from discrete sensor observations. Modelling procedures will be tested for all three contexts (crop, soil, and weather data) and validated against agricultural knowledge base (WP3).
This validation will enable to incorporate the uncertainty component into the calculation. Due to the time and space stamping of individual sensor measurement and its comparison with legacy historical data it will be possible to visualize the time-series but also forecast the possible endangerment. This task will also concentrate on evaluation of innovative cartographic techniques for both interpolation and change detection.
WP1.4 Contextual visualisation and geo database design and development (10/10 – 8/11)
Following the chosen monitoring models (WP3.2) there will be prepared four different context visualization rule bases. One for the basic topographic background and ordinary tracking regime and three according to the sensors used (crop, soil, weather). Experimental databases will be built for monitoring areas and visualization rules tested in close cooperation with WP2 and WP3.
WP2 Sensor network development (WP leader WLI)
As a background for the agriculture monitoring, we propose a concise description of the services that are needed in the different stage of crop production from the perspective of this project. There are four basic kinds of services, which have to be analysed: Sensor services, Networked services, Services integrated sensor services with SDI, and Localisation services.
For the single sensor node, there are proposed four basic components: a sensory transducer(s), a radio transceiver, a power unit and a processing unit, to guarantee its work in sensor network. Certain nodes in the network may possess only the latter three components: these are relay nodes meant to process and pass information from other sensors to the monitors. We assume that heterogeneity of transducers can exist in the sensor network, and that most sensors have limited computational power and storage space. WP2 is split into following tasks:
WP2.1 Conceptualizing integrated design of Wireless sensor network (1/09– 8/09)
Requirements for the sensor network and the subsequent system specifications are tightly connected with the intended application. In the initial stage there will be illustrated the main requirements on the sensor network. Special attention will be paid to the network topology and deployment, the reaction time (critical state of the phenomenon observed through a sensor network), reliability and accuracy outperforming those achievable by a single sensor (the metrics to be employed for the assessment of the reliability and accuracy), requirements for the radio links, survey of components, wireless sensors prototypes.
WP2.2 System design (9/09 – 4/10)
The objective of system design is, starting from a common paradigm, the development and the performance evaluation of high level algorithms to be implemented in the sensors to let the network perform different functionalities (e.g. field measurement, event detection, clustering, swarming). Most of the efforts will be devoted to the algorithms developments and to their performance analysis by simulations and, wherever possible, by theoretical analysis. Each type of network functionality will provide the context under which the algorithms will be developed.
WP2.3 Sensor node development and validation (5/10 – 5/11)
The sensor node prototype development is faced, taking into account the design specifications devised and the constraints and requirements coming from the scenarios/application and system development (see WP3.2). The activities will focus on the feasibility assessment, project specification and simulation procedures, and prototype node development including integration, validation and testing of individual technological components.
WP3 Agricultural monitoring and knowledge base (WP leader MUAF)
Specific objectives:
- Focus on utilisation of modern information and communication technologies for the sustainable developing in rural regions.
- Set monitoring areas.
- To establish a Crop control model, Soil fertilizer model and Weather control model concluding first step on the field on beginning vegetation season to the last step before crop product is exported to the market.
- To explore experience from running systems using IT technologies and support their progress.
- Establish monitoring and service systems via using IT technologies in crop production, farm management and decision make support.
WP3 consist of following tasks:
WP3.1 Agricultural knowledge base development (1/09 – 12/09)
Task will start with the analysis of currently existing agricultural information and knowledge base systems for phyto-monitoring and prognoses purposes. Further there will be proposed and established a new prototype of knowledge base and identified possible monitoring areas for the project purpose. Appropriate field data for effective agricultural monitoring and data warehousing will be suggested and granted to WP1.1 for cartographic modelling and evaluation.
WP3.2 Monitoring areas and sensor evaluation (1/10 – 6/11)
Task will concentrate on the identification of appropriate monitoring characteristics and commercial of the shelf sensors availability. The main deliverable of this task will be the design of architecture for exploitation of Internet technologies and mobile communication in rural areas. Three monitoring models will be proposed - crop control model, soil fertilizer model, and weather control model – to be integrated with the project framework. Work on this task will continue under the supervision of WP4.
Areas of the activity of WP3 (MUAF):
A. Mapping (assessing) the spatial and temporal variability in selected agrometeorological parameters in the field
Soil and canopy sensors for observing the temporal variability in agrometeorological parameters will be placed in selected plots with a larger area (30 – 50 ha). A grid density will be determined according to the analyzed spatial variability in soil conditions and stands in last years. The entire plot, its soil conditions and vegetation will be mapped using airborne sensing (multispectral and thermal cameras) and soil electric conductivity, yield and/or other parameters will be measured at selected growth stages through the growing season. These measurements provide a survey about spatial variability in the mentioned characteristics but not about their temporal dynamics due to technology possibilities and cost requirements. If stationary sensors are used, information on temporal dynamics of the examined parameters can be obtained. It can be assumed that appropriate combination of both types of mapping/measuring can provide more detailed data for decision making in agronomic treatments with regard to concrete conditions of the location.
B. Assessment of temporal dynamics of selected agrometeorological parameters in field crops
Temporal dynamics of soil and canopy agrometeorological parameters will be assessed on the selected economically most important farm crops representing main groups of grown crops using soil and canopy sensors. The measurements will be carried out under controlled conditions in small-plot experiments at the Field Experiment Station of MUAF at Žabčice. In addition to different crops, the measurement will also include variants of different practices of soil tillage, stand establishment and nutrition level. The obtained results of these measurements will provide information on the differences in the examined parameters among individual crops and variants of their crop management practices. In this way, more detailed basic data will be achieved for target differentiation of agronomic treatments.
With regard to more precise characterization of the differences within the fields and among the crops obtained by using new technologies, the attained results will enable to innovate teaching of the subjects aimed at plant production at the FA, MUAF in Brno.
WP4 Infrastructure integration and pilot implementation (WP leader MU, 4/10 – 12/10)
WP4 integrates all components of the project. This task will deploy the main project ideas in a set of practical situation for data collection, management and validation relevant for scenarios of Crop control model, Soil fertilizer model and Weather control model. This work will include the upgrade of the existing sensors and of the prototypes developed by the project, as well as the network integration into an on-line data cartographic visual analysis and infrastructure interoperability to carry out proof-of-concept tests and the final evaluation. Beside the support of the whole partnership, the networks will be deployed, integrated in the on-line analysis infrastructure and finally evaluated. End-user partners will explore and asses the potential of this technology in the framework of agriculture management.
3. Conceptual and methodological approaches to solving of projects and discussion of proposed requirements
Cartographic visualization of sensor data for public uses is often called “pervasive mapping”. The core of this cartographic technology is real time or near real time visualization of different phenomena with a short period of updating. Traditional area of pervasive mapping is visualization of topical meteorological data or weather forecast maps. Nowadays this attitude seems to be a vital proposal also for other areas of use like emergency management, transportation information, or fire detection systems. Taking into account only simple visualization of sensor data by standard cartographic visual variables (symbol maps, scalable symbology, and annotation) the initial part of the research is reduced to the perception study and effective software implementation of appropriate visual techniques. While the technological line of sensor-Internet communication is well known and widely used, its implementation with SWE standards in mind is innovative approach and brings new challenges towards sensor geospatial enablement and interoperability. However traditional interpolation methods used for the continuous grid generation with a defined resolution are not appropriate for sensor networks. These methods are often too slow-paced and would take too much time for near real time visualization of sensors. Incremental interpolation methods and other alternative visualization will be tested and validated during the project in order to reach short processing time and minimise delays between data delivery and visualization. It is clear that change detection plays a significant role in sensors visualization. For this reason time series visualization represents the third concept to be solved. Commonly used time series visualization techniques (animation loop) will be studied and new alternatives for change detection and highlight will be proposed.
From the sensor development point of view “Smart Dust” is an emerging technology made up from tiny, wireless sensors or “motes.” The network of motes would notify a central monitoring station of the measured parameters and the location of the mote that noticed it. Equipped with prompt notice of the current situation and its approximate location, agronomists could decide about concrete management actions. By linking networks of motes to a central management system, the system can be extended to monitor an enormous region. For other purposes, different kind of sensors could be used, but smart dust seems to be solution also for other level of sensors.
Large-scale sensor networks impose energy and communication constraints, thus it is difficult to collect data from each individual sensor node and process it at the sink. The expected solution will be based on the wellknown representation of data – contour maps, which trade off accuracy with the amount of samples. By reducing the number of transmissions required to convey relevant information to the sink, the proposed contour mapping scheme saves energy and improves network lifetime.
It will be considered a network of fixed sensor nodes that are deployed in a 2 or 3 dimensional space. A set of monitoring nodes, defined as sinks, are responsible for collecting data reports from sensor nodes.
It is assumed that knowledge of sensor node locations will be calculated from position of sensors with GPS and from network. The location information needs to be precise. It could be computed even after deployment. The network will have multilevel hierarchy.
There are three main modules of sensor’s network behaviour for the proposed AgriSensors system:
- Standard reporting.
- The system can visualize a customized set of measured values and their derivatives, used by a farmer in daily control practice. These values are stored in a separate database for further modelling and time-series visualization..
- Exception reporting (warning).
- The system enables the early detection of unexpected disorders in plants. This function is based on a variety of measured indicators of crops, soil, and weather.
- Decision-support system.
- It enables the possible tuning of climate and irrigation regimes by trial-end-error approach.
Extremely high sensitivity and short response time of the monitoring channels eliminate the risk of crop damage. A farmer can make a little change in a control regime and then he may get a detectable response of plants within 1-2 days. He can also automatically set and change the alert level of variables through the SWE standard interface.
3.1. Utilization of required resources
The required resources will be utilized in the following way:
- for extension and maintenance of professional development environment and publications related to open-source software;
- for creation of program routines in the field of database machine based on our design;
- for services related to fine-tuning of operation system and www server;
- for purchase of data storage media and expendables;
- for elaboration of initial user requirements analysis and commercial sensors availability;
- for reimbursement for programming woks;
- for presentation of project results in national and international conferences (EU project workshops, annual conferences of ICA, TIES, EFITA, and GI/GIS national conferences).
A significant part of required funding is represented by personnel costs for creation of part-time positions for team members that are not permanent employees of grant applicants and costs of cooperation with external specialists (mainly in the field of Sensor web enablement and agricultural information systems), and also for scholarship of doctoral students.
All developed procedures and software will be available as an open source package, to be available for further development. The proposed architecture has to be open and independent on technical solutions.
4. Expected results and dissemination
The main expected result of the AgriSensor project is the development of integrated portal for cartographic visualization of sensor based agricultural data including pilot implementation on selected monitoring areas. Portal cartographic functionality will be developed and refined according to the identified requirements. Besides that further partial results will be achieved including:
- An evaluation of current technological level for Sensor Web Enablement systems standardization.
- A design of communication and visualization interface (an open architecture) and services.
- A design of a integrated sensor and geoinformation portal architecture according to expected requirements to functionality and content.
- The development of portal prototype and relevant services. An application of open architecture to enable a full portal extensibility.
- Modelling tools for an effective visualization of sensor network data.
- Contextual visualization rules and scalable geo database design for monitoring models;
- Basic sets of alternate types of signs, colour and pattern libraries.
- Pilot evaluation of the prepared prototype in a selected area.
Dissemination
There exists a strong call for information and experiences to be more openly shared. While it is recognized that many research projects are still addressing unanswered questions, there is much information that can be disseminated widely now. In order to overcome this shortcoming we propose following methods of dissemination:
- Publication in scientific journals in the Czech Republic and abroad.
- Participation at the conferences targeted to sensor web, cartographic visualization, and agricultural information infrastructures.
- Web pages will be prepared for the project in Czech and English versions. Web pages will cover project development, publicly available materials and secured prototype portal interface.
- The use of on-farm demonstrations.
- Synergy with ongoing European projects – WinSoc and Humboldt.
5. Importance of grant project for practice or in another socially important context
The goal of the AgriSensor project is to develop the next generation of user-friendly, dependable, costeffective and interoperable general-interest visualization service, meeting user demands for flexible access to information, for everybody, from anywhere, at any time. This development will be compatible with soon-tocome highly capable digital devices and expected multimedia-based services responding quickly, accurately and flexibly to the citizens needs. Hence, the project will identify and define standards and formats assuring comparability, compatibility and interoperability for the data flow in and out of database. Furthermore, it will ensure the security, confidentiality, reliability and accessibility of common data, real-time translation capability, robustness and user friendliness.
6. Preparedness of applicants
The work team is set up as an interdisciplinary collective. Its core is represented by employees of the Laboratory on Geoinformatics and Cartography (LGC), which provides research and education in the field of digital cartography and GIS at the Institute of Geography, Faculty of Science of Masaryk University. The laboratory was established in 1992. The LGC team members have been working on GAČR grants no. 205/03/1102: Open Regional Electronic Atlas and S205/07/1278: Cartographic visualization and modelling of contemporary trends in health status and healthcare in the Czech Republic. The laboratory is equipped with a range of commercial GIS environments and tools for cartographic publications. Besides that, the laboratory develops its own applications on basis of Open-source web GIS environments Mapserver and Jshape.
WIRELESSINFO (WLS) is non-profitable Czech association - virtual research institute founded in 2003 by Czech participants on project WIRELESSINFO IST 1999- 21056. Main goals of WIRELESSINFO association are to coordinate activities in research, new development, testing and exploitations of new information systems and technologies for data collection and data transport on the market, which are collective for all members. WLS has a very wide field of activities with a big exploitative potential on both on Czech Agricultural market and European Agriculture market (IST for agriculture and forestry , GIS and SDI , Web services , E collaboration , Mobile solution , E learning). WirelessInfo has large experience from past and running projects: WirelessInfo, Premathmod, The VOICE, AMI4FOR, AMI@Netfood, Navlog, MILQ – QC, c@r, The FutureFarm Project.
The WirelessInfo will offer project expertise in area of sensor deployment, communication between sensors and Web environment and also implementation of Sensor Web Enablement service. Due its previous experience with commercial implementation of Prefarm system, it will also cooperate on integration of solution.
Department of Agrosystems and Bioclimatology (Faculty of Agronomy, Mendel University of Agriculture and Forestry in Brno - MUAF) provides research and education in the field of plant production, farming sustainability, bioclimatology, precision agriculture and herbology. The department disposes of experimental station in Žabčice (23 ha of arable land) with its own meteorological station. Some research is conducted on other localities in the Czech Republic too. For research and development of precision agriculture there is available high-tech equipment like instruments for evaluation of soil and crop conditions including multispectral and thermal camera, hyperspectral scanner, DGPS, and efficient statistic and GIS software for results processing and evaluation.
| WP | Responsible project partner, person(s) |
| WP1.1 | MU, S1, Kubíček |
| WP1.2 | MU, S1, Kubíček, Friedmannová |
| WP1.3 | MU, S1, Kubíček, Friedmannová |
| WP1.4 | MU, S1, Friedmannová |
| WP2.1 | WLI, Křivánek, Charvát |
| WP2.2 | WLI, Křivánek, Charvát, Gnip |
| WP2.3 | WLI, Charvát, Gnip |
| WP3.1 | MUAF, Křen, Lukas, Neudert |
| WP3.2 | MUAF, Lukas, Neudert |
| WP4 | MU, Kubíček, Friedmannová , Charvát, Gnip |
8. Literature
Campbell, J.: Map use and analysis, McGraw-Hill, Boston, 2001, 372p.
Chu, X.: Open Sensor Web Architecture. Master thesis, The University of Melbourne, Australia, 2005.
IEEE 1451.1: Standard for a Smart Transducer Interface for Sensors and Actuators -- Net-work Capable Application Processor (NCAP) Information Model, IEEE, New York, 2000.
MacEachren, A.M.: How maps work: representation, visualization and design, Guilford Press, New York, 1995, 513p.
Reichardt, M.: Sensor Web Enablement: An OGC White Paper, Open Geospatial Consortium (OCG), Inc., 2005.
Simonis, I., et al.: Interoperability of Simulation and Geoinformation Standards. Proceedings of: Spring-SIW, Orlando, Florida, 2003.
Slocum, T.A., McMaster R.B., Kessler F.C., Howard H.H.: Thematic Cartography and Geographic Visualization, Pearson Prentice Hall, 2005, 518p.
Sveda, M., Trchalik, R.: Smart Sensor Networking with ZigBee and Internet, 2006.